I'm migrating our web and database hosting to a new environment on all new machines. I've recently performed a Load Test using WAPT to generate load from multiple distributed clients. The server has plenty of room to handle the traffic load, but I'm seeing an odd pattern of incoming traffic during the load tests.
Here is the gist of our setup:
- Firewall server running MS Forefront TMG 2010 on Win 2k8 server
- Request routing done by IIS Application Request Routing on firewall machine
- Web server is a Hyper-V VM on the Database server (which is the host OS)
- These machines are hefty with dual-CPU's with six cores (12 total procs)
- Web server running IIS 7.5
- Web applications built in ASP.NET 2.0, with 1 ISAPI filter (Url Rewrite) in front
What I'm seeing during the load tests is that the requests all come through in bursts. Even though I have 7 different distributed clients sending traffic loads, the requests come through about 300-500 requests at a time.
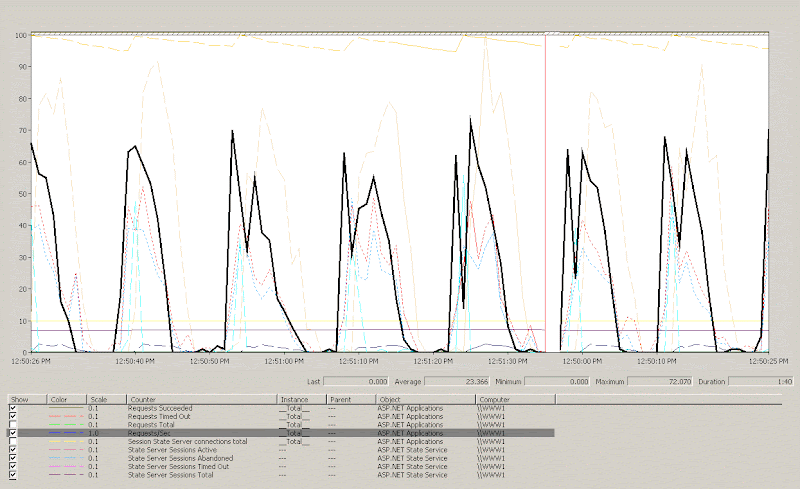
The performance monitor shows nearly all of the counters moving through this pattern, where a burst of requests comes in the req/sec jumps to 70, the queued requests jumps to 500, the current requests jumps up, the CPU jumps up, everything. Then once it's handled that group of requests, it has a lull for nearly 10 seconds where nearly nothing is happening. 0-5 req/sec, 0 queued requests, minimal CPU usage. Then after 10 seconds of inactivity, another burst comes through, spiking all of the counters once again.
What I can't figure out is why the requests are coming through in bursts when I know that the load being generated is not sent that way, especially considering the various load-generating clients sending traffic all in different intervals with random think time's between each request. Is there something in the layers between Hyper-V or perhaps in the hardware which might cause this coalesce of requests together?
Here is what i'm looking at, the highlighted metric is Requests/sec, but the others critical counter go with it: Requests Queued (which I'd obviously like to keep as close to 0 as possible).
Any ideas on this?
-
After a lot more testing and research, I have resolved this issue as being a result of the WAPT load testing tool. There were some settings that, when tweaked, changed this pattern.
I confirmed that this was a product of the WAPT testing tool once I setup a WAPT instance and used Performance Monitor on both the Web server and the machine generating the load. It is easily correlated to see the packets sent on the Network Interface spike at the same intervals and times that the Requests/sec do on the web server.
From MaseBase
0 comments:
Post a Comment